
Calendar network diagram as a cardiogram of a megaproject, or the "Saw" effect
28.01.2026



Preface: anxiety
Project timeline management begins with the Project Baseline-an approved version of the project schedule that serves as a benchmark for measuring progress and deviations. The classical approach requires that this plan remain unchanged. However, in practice, especially when managing large-scale projects, changes accumulate, reaching a "critical mass". This occurs due to changes in restrictions, clarification of technical solutions and the identification of additional work or volumes. The basic plan loses its relevance, and its revision becomes not a recommendation, but a necessity. In megaprojects lasting three years or more, this process is inevitable: practically at the next control gate (Gate), the parameters are clarified and the updated Basic Plan is approved.
But even with the current plan, those leading large construction projects have a familiar feeling.
Live example: end of week 9. Report for the period: "traffic light is green". The fact is close to the plan, the forecast is within the acceptable range, the deviation is less than a week. Formally, everything is fine. And at the same time, there is a quiet panic inside: we are missing something.
Fig. No. 1. Sample report:

From the point of view of the report, the situation looks stable: if the current pace is maintained, the predicted result is ≈ 98.3% of the plan. "Today" corrective measures are taken, performance levels out, indicators remain green.
Classic tools for monitoring and controlling project deadlines: the "plan-actual-forecast" report shows "WHERE ARE WE NOW?" They provide a snapshot of the project's status: percentage complete, forecast completion, current backlog, etc. However, these tools do not show "HOW WE GOT HERE?" - do not show the dynamics of changes and the cumulative effect.
What to do when deadlines need to be met at any cost, but there is blind anxiety inside?
First of all, the work requires a tool for measuring the intensity of the project over a period, i.e. speed and density of work. Simply put, you need a ruler to measure: you can only manage what you can measure.
On megaprojects, especially in which the Center for Rapid Response and Forecasting works, and where schedule network planning plays a key role, we use a line diagram with the figurative name "Saw" as a project cardiogram. Essentially, this is a way to show a project implementation schedule in a living rhythm of pulses of changes in the estimated completion date, where each jump in the form of a "teeth" is the history of the decision made.
The horizontal axis shows time (weeks, months), and the vertical axis shows the estimated completion date of the project. Each "teeth" reflects a jump in this date due to the recalculation of the "work schedule" based on a decision made (for example, redistribution of resources or change in task priority).
Name image
"Saw" is a visualization of the cyclical dynamics of the project, which conveys the essence of the approach. The teeth symbolize the alternation of phases of work intensity: from peak to failure.
A project is a living organism with a pulsating rhythm. "Saw" reflects cyclic fluctuations in load and, like a cardiogram, makes this cycle visual, measurable, and therefore controllable.
Simple rule
Create a simple rule in the project, of course, if you have modern project management technologies and software for KSM: when updating the fact of completion and recalculating the schedule on a weekly basis, save the "estimated project completion date", the last key milestone at which all work converges. At the same time, consciously remove all restrictions that affect the correct recalculation. Let the system show the bitter truth: the "project completion forecast" as it is.
Fig. No. 2. Example table:
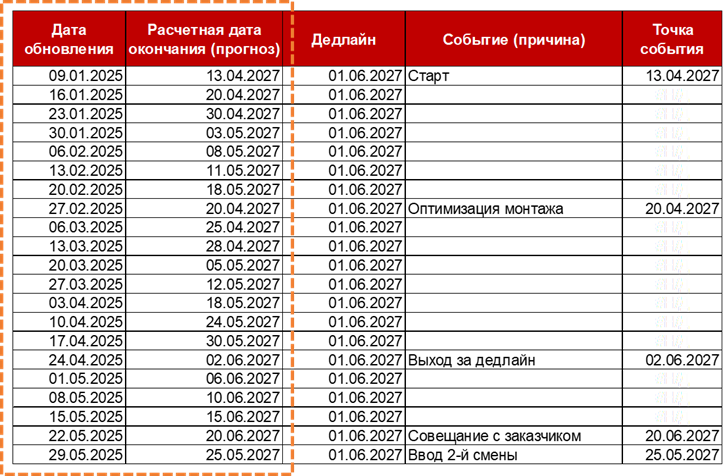
Then connect these points on a graph. In a healthy, realistically manageable project, the forecast line will never be straight. Moreover, in a stable system, the same value of the forecast date should not be repeated in a row for more than two reporting periods (for example, two weeks). If the date "froze", this is an alarming signal: either the schedule has ceased to be counted honestly, or the project has entered a mode of uncontrolled drift, where management decisions do not affect the result.
"Saw" begins with this honesty. Each new point is a diagnosis. Combined together, they form a cardiogram, from which one can judge not about individual symptoms, but about the health of the project as a whole.
Fig. No. 3. Example diagram:
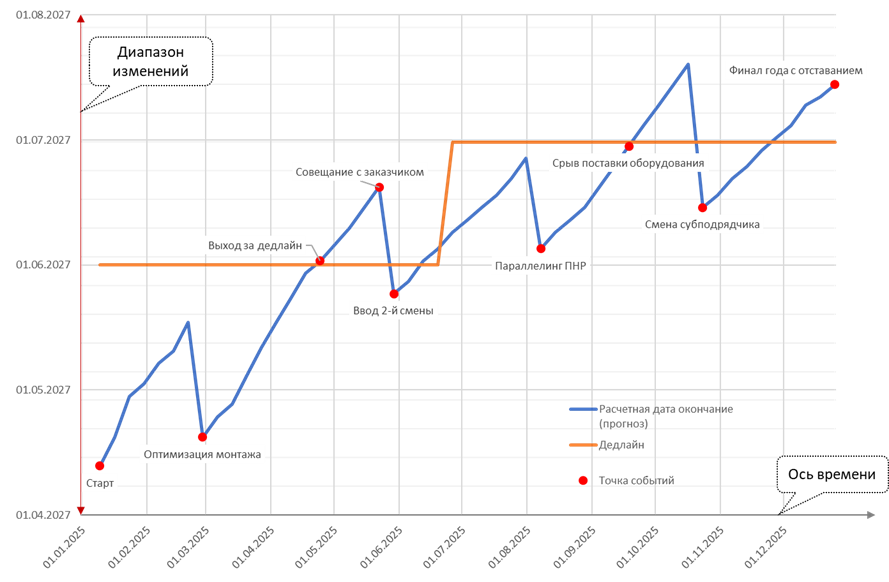
What do the saw teeth show?
Why should the diagram look exactly like this - uneven, "sawtooth"? Because it reflects two fundamental phases of the project life cycle, which replace each other.
1. Prong up (Problem accumulation phase).
The forecast line is creeping up - the deadline is moving forward. This is not a mistake, but the physics of the process. Deliveries are delayed, a crane breaks down, the weather is bad, approvals are delayed, and so on, all this requires proactive project risk management. A live project is bound to accumulate backlogs periodically. If your "cardiogram" draws a perfect straight line for a month, they are almost certainly not telling you something: either they don't calculate the graph honestly, or they imitate stability where there is none.
2. Cliff down (Management intervention phase).
The line going down is not a miracle or an accident. This is the result of a conscious decision. When the lag reaches a critical point (technical or psychological), a "cog shear" occurs.
The project management team (PMC providing project management support) seeks reserves, changes the installation sequence, adds crews, and optimizes technology. Once recalculated with this new organizational decision, the forecast date bounces back, preferably to the baseline. This is management in action.
Thus, each tooth of the Saw is a complete story that can be used as a lesson learned during the implementation of the project: problem → awareness → solution → result.
This is how project management works: transforming a chaotic flow of events into a series of controlled, measurable and mentoring cycles.
1. Step 1: Enter the fact. Load data on the actual execution of work into your schedule network model (Primavera, MS Project).
2. Step 2: Remove the crutches.
- Before recalculation, find and temporarily disable a hard constraint on the project end date or key milestone (for example, "Finish No Later Than").
- Do this on a copy of the schedule or remember the original value so you can return it later for reporting. The goal is to allow the system to show a "clean" forecast.
3. Step 3: Create a table. Create a simple file (Excel, Google Sheets) with columns: "Date Updated" and "Estimated Finish Date (Forecast)."
4. Step 4: Record your forecast. Recalculate the schedule. After this, enter the current date and the resulting value of the predicted finish date (Calculated Finish Date) into the table.
5. Step 5: Construct a cardiogram. Select the data in the table and create a line chart using it. The points connected by a line will show the first "tooth" of your "Saw".
6. Customize the display of key events
Tip: Repeat steps 1, 2, 4 and 5 weekly. After recording the forecast, you can return the end date constraint ("crutch") to the model so that it continues to be used for the necessary reporting on the external contour of the project.
Your first cardiogram of the project is ready.
Important: two features you need to know and not be afraid of
Using the Saw method, you will encounter two non-obvious, but absolutely normal phenomena. They must be understood and accepted in order to correctly interpret the data.
1. Nonlinearity of response.
The change in the project completion forecast is not equal to the duration of the period for which the recalculation was made. If you update the chart once every 7 days, the forecast date may move more than 7 days, either to the right (deterioration) or to the left (improvement). This is not a mistake. This is a reflection of the fact that even a small fact that enters a critical chain can have a cumulative effect on the entire duration of the project, opening or closing entire "windows" of opportunities in the future. "Saw" captures precisely this "leverage" effect.
2. The effect of the forecast "freezing" at the finish line.
Once the overall project completion rate is around 95%, the projected completion date may "freeze" and stop changing significantly from week to week. This does not mean that recalculation has stopped working. This is due to the transition to the closure phase: work remains to clarify acts, draw up documentation, eliminate deficiencies - their volume and duration are difficult to accurately model in the network diagram, and they have little effect on the overall duration forecast, which has reached a "plateau".
At this moment, "Saw" fulfilled its main task - it recorded the dynamics of the project at the main, most difficult stage, and now its data serves as a story for analysis and learning lessons.
Knowing these features eliminates false alarms.
Summary:
A critical reader may reasonably ask: "Why reinvent the wheel if there are classical tools, such as the S-curve, which also reflects the dynamics of the project?"
The answer is simple: we don't innovate, we adapt. We take tools that really help in our work and share our experience of using them. Because a true professional should have not just one universal key, but a full-fledged set of specialized tools for any practical situation.
If a master comes to you with one "universal" tool for all occasions, you will doubt his professionalism. It's the same in project management: each situation requires its own approach. It is necessary not just to "tighten the screws" with general pressure, but to accurately diagnose and "treat" the problem without harming other processes.
Take the entire set of tools with you to the project:
- The S-curve is a strategic control tool, a "view from above." It answers the question "WHERE are we?" relative to the volume and cost plan.
- The Golden Nail is a tactical mobilization tool, "local heating." It answers the question "HOW to squeeze?" to meet a key deadline.
- "Saw" is a tool for operational diagnostics and independent examination of the project, "ECG". It answers the question "HOW do we breathe?" by showing the rhythm and efficiency of our work in real time.
There is no one right method. There is a situation, and you need to choose the right tool for it. "Saw" is not a replacement for the classic, but an important addition to it. It adds a ruler to your arsenal of measuring events, allowing you to see into the rhythm of the project.